[Research] LLVM based VMProtect Devirtualization: Part 1 (EN)
Introduction
Hello, this is banda.
Among the well-known programs used for code obfuscation are VMProtect and Themida. Of these, VMProtect is particularly recognized for performing virtualization and obfuscation based on a virtual machine (VM). VMProtect transforms the original code into its own bytecode through a non-standard virtual architecture, making both static and dynamic analysis extremely difficult. (If you’re curious about a previously written research article on obfuscation, (👉check it out here))
Over time, there have been numerous papers and studies attempting to deobfuscate VMProtect. In this article, I will focus specifically on methodologies that leverage LLVM to achieve deobfuscation, and examine how feasible such approaches really are. (Note that in this post, I will focus exclusively on the virtualization option among VMProtect’s protection features.)
VMProtect

VMProtect is a software protection program that applies Anti-Reversing techniques. According to the official documentation, it is used to protect application code and prevent cracking, and it provides a custom scripting language and a built-in disassembler to finely control the code regions to be protected and the build process. It primarily performs binary obfuscation on Windows-based native applications such as C/C++, Delphi, and Visual Basic.
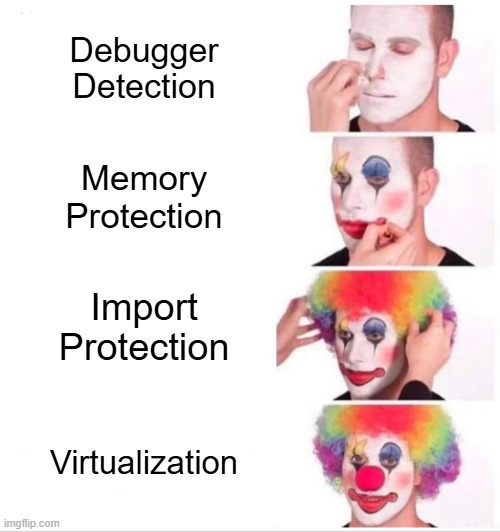
As of VMProtect 3.9.6, the available obfuscation options are:
① Memory Protection, ② Import Protection, ③ Resource Protection, ④ Pack the Output File, ⑤ Debugger Detection, ⑥ Virtualization Tools Detection, and ⑦ Virtualization.
Among these, Virtualization is considered one of the strongest protection techniques. In this approach, the original x86/x64 code is transformed into custom bytecode defined by VMProtect, and during execution, an embedded virtual machine interprets and executes that bytecode. Furthermore, within a single binary, multiple types of VMs can be mixed together, and various parts of the code—including the entry point—can be selectively virtualized.
VMProtect with LLVM
Research on analyzing VMProtect with LLVM has generally taken two directions: static lifting, which aims to understand the internal structure of the VM, and dynamic tracing, which focuses on the execution results rather than the internal details.
Static Lifting
The first approach treats the VM internals as a White-Box and applies static lifting. In this method, each
VmHandler(the virtual instruction handlers that make up the VMProtect VM) is reversed and its behavior analyzed, then reimplemented asHelper Functionsin C++. The protected VM bytecode is then translated into a sequence of these helper function calls, ultimately reconstructing the entire program as LLVM-IR. However, this method requires deep understanding of the VM architecture. (reference)Dynamic Tracing
The second approach uses dynamic tracing to execute the VM and applies a Black-Box method that focuses on uncovering the relationship between inputs and outputs to deobfuscate functions. By supplying specific inputs and running the program, every executed instruction is recorded into a “trace.” This trace is then reconstructed through symbolic execution to derive the input-output relationship expressions. (reference)
LLVM IR과 SSA (Single Static Assignment)
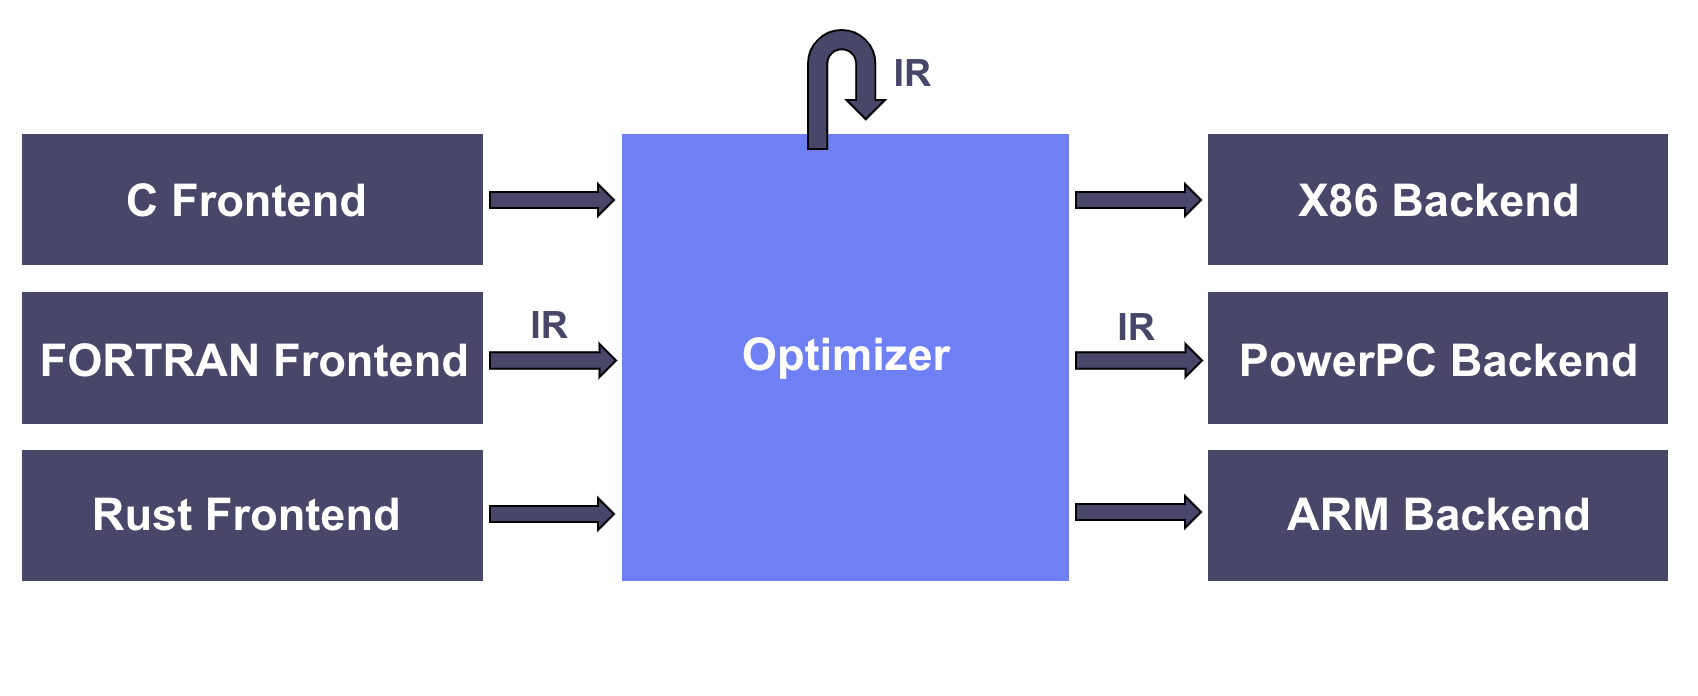
LLVM IR uses an Intermediate Representation (IR) based on the SSA (Static Single Assignment) form. SSA follows the principle that each variable is assigned only once, and whenever a new value is computed, a new virtual register (SSA variable) is created.
Let’s compare the following assembly code with its LLVM IR equivalent.
add rax, rcx
sub rdx, rbx
sub rax, rdx
%rax2 = add i64 %rax, %rcx
%rdx2 = sub i64 %rdx, %rbx
%rax3 = sub i64 %rax2, %rdx2In the LLVM IR code, you’ll notice variable names like %rax1, %rax2, and so on. This happens because of the SSA principle: once an SSA variable is defined, it cannot be overwritten. As a result, LLVM IR provides the advantage of making data flow and computation results easy to track.
So why is this SSA-based LLVM IR important for devirtualizing VMProtect?
VMProtect’s virtualization handlers introduce thousands of operations—bitwise logic, shifts, arithmetic—intentionally mixed to generate noise and conceal the original logic. To achieve this, VMProtect often uses MBA (Mixed Boolean-Arithmetic) expressions, which are complex algebraic transformations of simple operations.
Here’s an example of an MBA expression produced in VMProtect virtualization:
(bvor
    (bvnot (bvor (bvnot (bvnot x)) (bvnot y)))
    (bvnot (bvor (bvnot x) (bvnot (bvand (bvnot y) (bvnot y)))))
)
The expression above is equivalent to a simple x ^ y operation, but it isn’t straightforward to recognize at first glance, is it?
By converting such complex expressions into SSA-based LLVM IR, the data flow becomes much clearer. Leveraging LLVM optimizations such as Constant Propagation, Dead Code Elimination, and Pattern Recognition, unnecessary operations and noise can be stripped away.
As a result, tens of thousands of VMP instructions can be reduced to just a few dozen SSA IR statements, allowing the recovery of a form that closely resembles the original operations!
Devirtualization
In this research article, I built upon prior experience in understanding VM structures through static lifting, while also referring to a dynamic tracing–based deobfuscation approach. For the practical work, I utilized Jonathan Salwan’s VMProtect-devirtualization Project to carry out dynamic tracing–based deobfuscation.
- pure function
#include <stdint.h>
uint32_t f(uint32_t x) {
  x ^= 0xA3C59AC3u;
  x = (x << 7) | (x >> 25);
  x += 0x9E3779B9u;
  return x;
}
The practical target in this study is pure functions. A pure function is defined as one that always produces the same output given the same input, without relying on randomness, global variables, or I/O operations.
Because of these characteristics, pure functions are particularly well-suited for devirtualization.
How It Works?
Execution trace of virtualized code (T’) =
Execution trace of original code (T) + Execution trace of virtual machine (VM) instructions (VM(T))
A trace can be thought of as a chronological log of the instructions executed by the CPU while the program runs. The goal here is to strip away the VMProtect layer (VM(T)) from the recorded execution trace T’, and recover the original pure trace T. The process can be broken down into the following five steps:
Identify the virtualized function and its arguments
Determine which part of the program is protected by VMProtect, and identify what inputs the protected function takes.
Generate a VMProtect trace of the target
Execute the protected function found in Step 1 and record a trace of every CPU instruction executed, capturing both the order and content of operations.
Construct symbolic expressions to obtain the relation between inputs and output
Analyze the trace from Step 2. Instead of concrete values, replace them with symbolic variables to express how the program computes its results in mathematical form.
Apply optimizations on symbolic expressions to eliminate unnecessary VM instructions
Simplify the symbolic expressions created in Step 3. During this step, instructions that only serve the VM’s execution (and not the function’s core logic) are removed.
Lift the symbolic representation to LLVM IR
Convert the simplified symbolic representation into LLVM IR, a hardware-independent intermediate representation. This LLVM IR can then be recompiled to produce a clean version of the original program, free from VMProtect obfuscation.
Through this process, we can ultimately obtain LLVM IR code with VMProtect’s obfuscation effectively removed.
Example: Bitwise Function
int bitwise_func(int a, int b, int flag) {
    VMProtectBegin("bitwise_func");
    int r;
    if (flag == 0)
        r = a & b;
    else if (flag == 1)
        r = a | b;
    else
        r = a ^ b;
    VMProtectEnd();
    return r;
}
In the provided example, a simple arithmetic operation was chosen, but I built code that also includes control flow. To analyze functions containing branching logic (as opposed to plain arithmetic), it is necessary to generate multiple traces in order to reconstruct the full logic.
Since an LLVM IR module inherently contains a Control Flow Graph (CFG), additional steps are required to merge the traces obtained from each branch into a unified CFG representation.
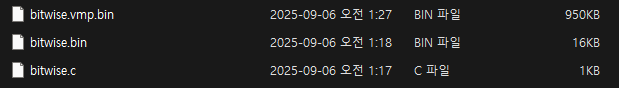
When comparing a binary before and after applying VMProtect’s virtualization option, you’ll notice a dramatic increase in file size. This is because the original code is transformed into VMProtect’s custom bytecode, and an interpreter (the virtual machine responsible for decoding and executing that bytecode) is embedded into the binary.
(As a side note, this increase in size can be significant enough that some developers choose not to enable the virtualization option. Still, when applied, the obfuscation effect is extremely powerful.)
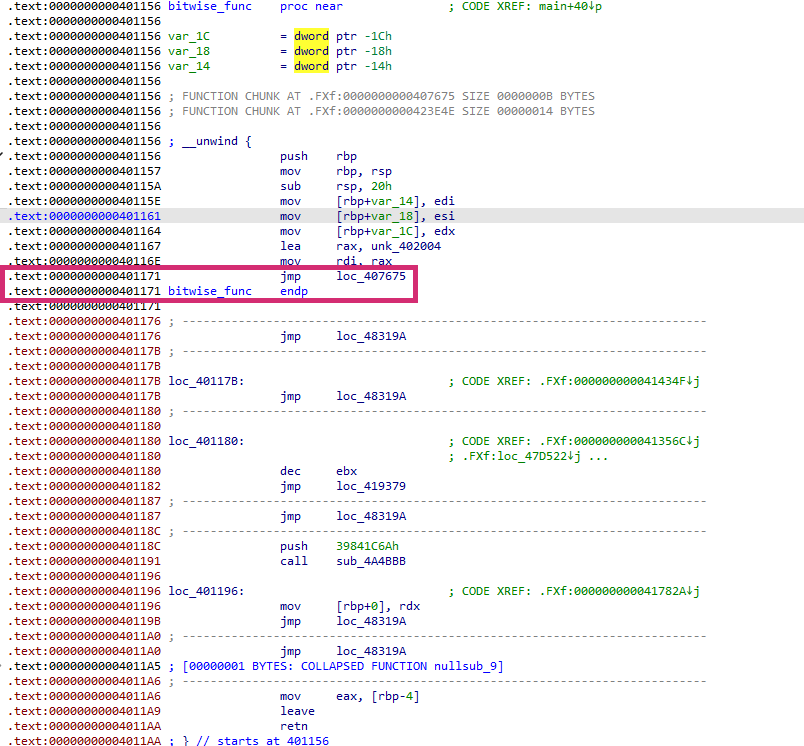
When examining the bitwise.vmp.bin file with the virtualization option applied, several interesting points can be observed. In my case, applying the basic VMProtect virtualization option did not change the function’s RVA, though depending on the chosen options, it may be altered.
Another notable characteristic is that instead of returning with a ret, the execution flow jumps via jmp to loc_407675, redirecting control not to the original code but to the VMProtect entry point. This behavior is a representative feature of virtualization.
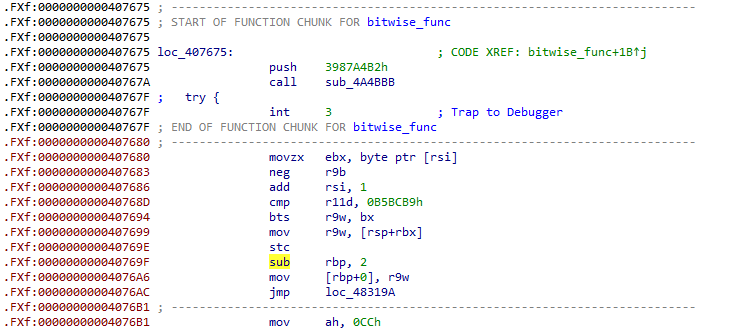
Let’s step into loc_407675. At the beginning, instructions like push 3987A4B2h, call sub_4A4BBB, and int 3 push the context value 3987A4B2h onto the stack and then call the sub_4A4BBB function, which marks the entry into the interpreter.
After this point, the execution proceeds into code blocks known as VmHandlers. Inside the loop entered via the call instruction, the interpreter repeatedly reads bytecode using the VIP (Virtual Instruction Pointer), locates the corresponding handler, and executes the defined operation. This loop forms the core of VMProtect’s virtual instruction processing.
Trace collection (Intel Pin)
📌 What is Pin?
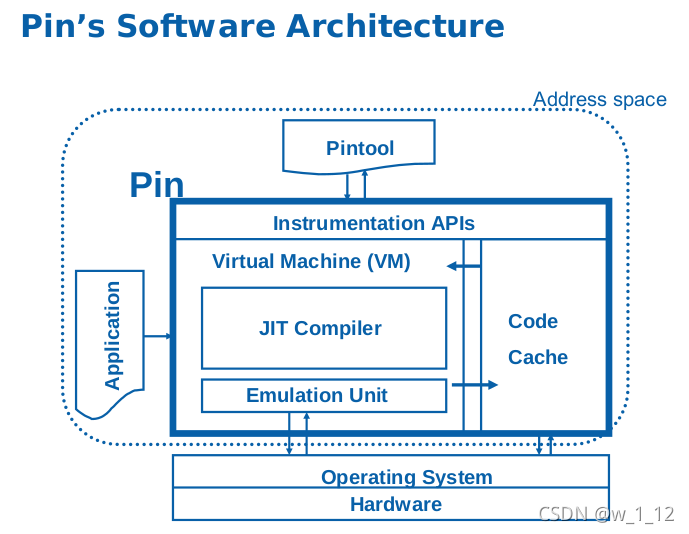
Pin is a Dynamic Binary Instrumentation (DBI) framework provided by Intel that supports both x86 and x64 binaries on Windows and Linux environments. Instead of modifying the target program directly, Pin intervenes in the execution flow through JIT (Just-In-Time) based code translation.
With Pin, users can insert their own custom pintools to monitor and record runtime behaviors such as instruction execution, memory accesses, and function calls.
By leveraging these characteristics, Pin allows you to intercept execution at the JIT stage, inject a user-defined pintool, and effectively collect traces of specific code regions you wish to analyze.
TRACE_AddInstrumentFunction(OnTrace, 0);

VOID OnTrace(TRACE t, VOID*) {
  for (BBL b = TRACE_BblHead(t); BBL_Valid(b); b = BBL_Next(b)) {
    for (INS i = BBL_InsHead(b); INS_Valid(i); i = INS_Next(i)) {
      // actual hook insertion
    }
  }
}
// registration
TRACE_AddInstrumentFunction(OnTrace, 0);
Pin operates in the following sequence:
- When the program runs, Pin intercepts the execution of a code block (Trace).
- Instead of executing that trace immediately, Pin first invokes the user-registered callback function (
OnTrace). - Inside
OnTrace, analysis code can be inserted or hooks can be added for specific instructions (essentially “code injection”). - The original code and the injected analysis code are then JIT-compiled together, so the program ultimately executes with both its original behavior + logging/analysis functionality.
Through this process, Pin can record every executed machine instruction without distortion.
./pin -t ./source/tools/VMP_Trace/obj-intel64/VMP_Trace.so \
  -start 0x401156 -end 0x4011AA \
  -- ./bitwise.vmp.bin 0 &> ./bitwise.vmp.trace
To collect a trace, you first need to confirm through prior static analysis the start address of the function to be analyzed (0x401156), the end address (0x4011AA), and approximately how many arguments it takes. Based on this address range, you can then use the Intel Pin tool to collect the trace.
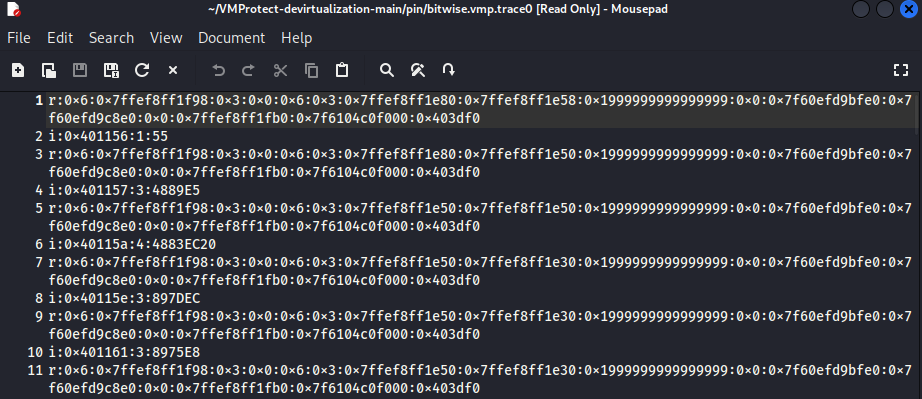
When examining the generated trace file, you can see that running bitwise.vmp.bin with the argument flag=0 under Pin produces a log of every machine instruction executed by the CPU within the specified range. The file follows a paired format of r: and i: entries.
r:(Registers): captures the state of all general-purpose CPU registers as hexadecimal values before the correspondingi:instruction executes.i:(Instruction): contains information about the actual executed instruction, formatted asi:<instruction address>:<instruction size (bytes)>:<opcode>.For example,
i:0x401156:1:55specifies that the instruction at address0x401156was executed, with0x55representing the opcode forpush rbp.
However, the trace file is far too large for a human to read in full. Instead, we can use tools such as attack_vmp.py to process it and generate LLVM IR that reflects the program’s original logic.
Finding vbraddr (Virtual Branch Address)
To fully reconstruct the logic of a function that contains branches, you need to analyze multiple trace files that represent different execution paths. However, VMProtect does not use straightforward branch instructions like jmp, jz, or jnz; instead, it relies on virtualized branching logic. As a result, the attack script cannot automatically determine exactly where the execution paths diverge.
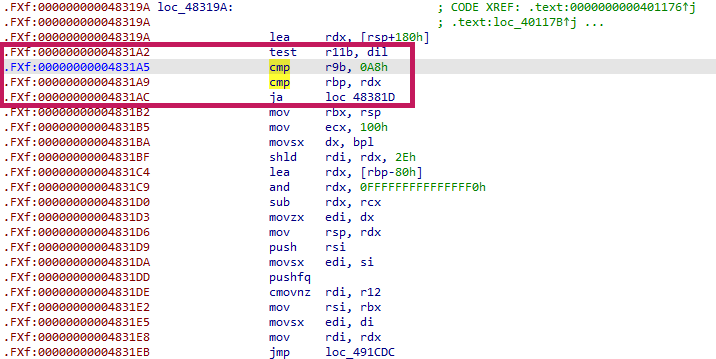
This is where the vbraddr value comes in — it must be identified manually in IDA and provided as input. Specifically, you should look for the points in the trace where comparison instructions such as cmp or test occur that decide the virtual branch.
In my case, the address 0x4831A5 corresponded to the virtual branch location. This vbraddr later serves as the reference point for where the CFG (Control Flow Graph) splits.
Let’s take a look at how the attack_vmp.py script works. This script is built on top of the Triton framework.
- Triton processes the executed instructions in the trace one by one, tracking registers and memory as symbolic variables.
- During this process, the states of registers and memory are represented in the form of an AST (Abstract Syntax Tree).
- Using Triton’s symbolic execution engine, a path predicate is constructed, mathematically modeling even conditional branches.
- As a result, VMProtect’s noise is eliminated during the concretization phase (where irrelevant values are folded into constants). Then, through the simplification passes and formula slicing features, the final expressions are reduced to mathematical formulas that capture only the relationship between inputs and outputs.
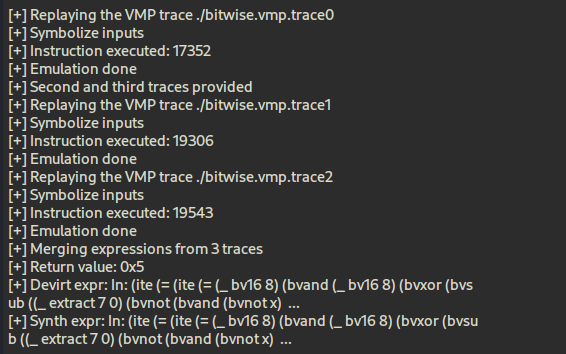
./attack_vmp.py \
  --trace1 ./bitwise.vmp.trace0 \
  --trace2 ./bitwise.vmp.trace1 \
  --trace3 ./bitwise.vmp.trace2 \
  --symsize 4 \
  --vbraddr 0x4831a5 \
  --vbrflag af
With the script, you can provide three different trace files, each following a separate branch, and pass them along with the --vbraddr and --vbrflag options. By doing so, you explicitly indicate the virtual branch decision point and the condition flag that governs the divergence.
Originally, the attack_vmp.py script supported only two traces at a time. I extended the functionality so that it can accept more traces, merge them, and reconstruct them into LLVM IR in a combined form.
The real question is: by supplying all three traces, can we successfully merge them and restore the function’s logic in a CFG (Control Flow Graph) format? This experiment aims to determine whether multiple execution paths can be stitched together into a complete devirtualized representation.
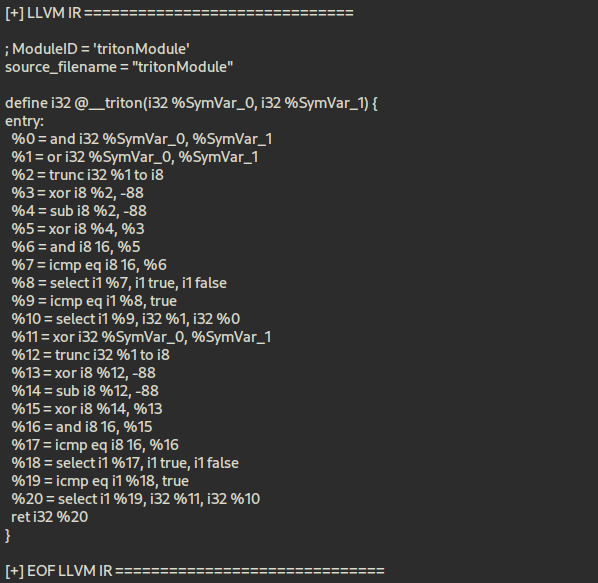
When reviewing the generated LLVM IR, it becomes clear that it accurately reconstructs the original code’s if-else structure along with the combinations of bitwise operations (XOR, AND, OR). (If you’re interested in the details, see the LLVM IR Language Reference.)
From the lifting results, we can see that for %SymVar_0 and %SymVar_1, the operations first apply AND and OR, followed by an XOR, with each step undergoing conditional checks to determine the final outcome. Comparisons like -88 or ==16 are simply noise introduced during VMProtect’s virtualization process and are not part of the core logic.
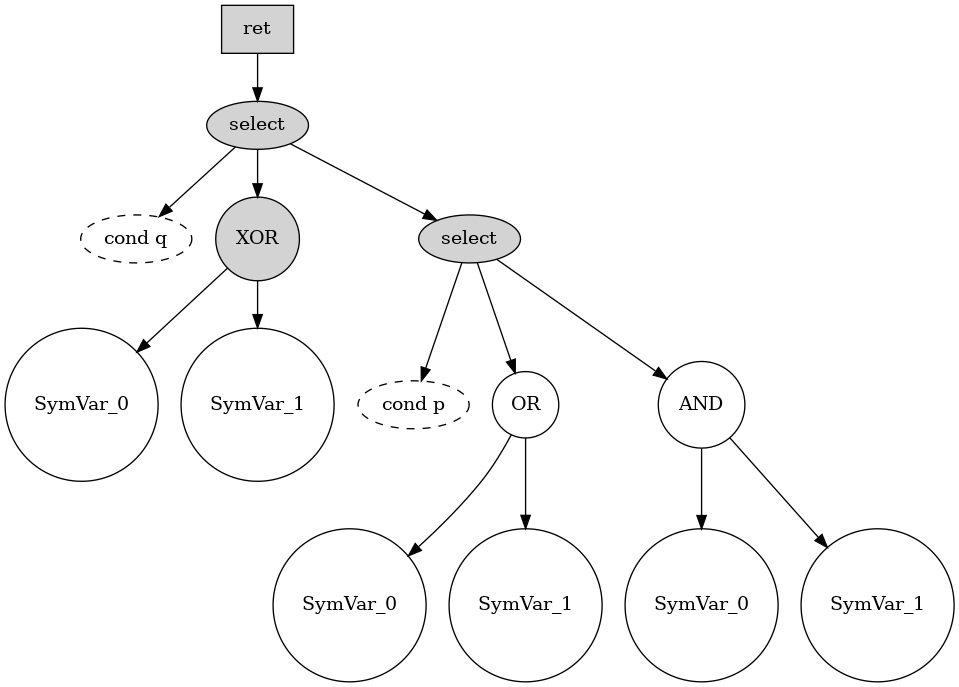
The graph above shows the result of devirtualizing a function that was virtualized with VMProtect, demonstrating a structure where the function’s return value is determined by a select operation. The first select node, depending on the condition cond q, chooses either the result of XOR between SymVar_0 and SymVar_1 on the left, or the result of another select node on the right. The select node on the right, depending on the condition cond p, chooses the result of OR between SymVar_0 and SymVar_1 if true, or the result of AND between SymVar_0 and SymVar_1 if false.
Conclusion
In fact, the LLVM-based devirtualization approach discussed in this article is effective for functions with a single path or only a few execution paths, but for programs with many paths, some code may be omitted. Therefore, applying this approach to real-world, large-scale code is still impractical. With that, I will conclude Part 1 of this research article here.
In the next part, we will explore the possibilities of devirtualization with a focus on static analysis based on related research papers, and we will also examine deobfuscation approaches not only for virtualization but for various other options as well.
Thank you for reading. XD
Reference
https://koreascience.kr/article/JAKO202106153172639.pub?&lang=ko
https://github.com/JonathanSalwan/VMProtect-devirtualization/tree/main

본 글은 CC BY-SA 4.0 라이선스로 배포됩니다. 공유 또는 변경 시 반드시 출처를 남겨주시기 바랍니다.